
Software Development Statistics 2026: A Global Industry Research Report
Software spending is forecast to reach $1.468 trillion worldwide in 2026, GitHub reports more than 180 million developer accounts, and 65.9% of respondents to Stack Overflow’s 2026 AI-at-work question selected coding assistants or agents. The three figures track different things, expenditure, platform participation and reported tooling, but together they show how quickly software production is expanding and changing.
How to read these numbers
This is secondary research, not a new survey. Sources include original publications from Gartner, GitHub, Stack Overflow, BLS, DORA, CNCF, Black Duck, ISG and METR, selected for direct relevance and identifiable measurement periods. Figures cover different populations and periods, including observed 2025 results, 2026 survey responses and future forecasts. Chart values come from the attributed publications; comparisons across sources are editorial interpretations, not pooled statistical estimates. Research cutoff: October 21, 2026.
1. Global software development market statistics
Software spending is forecast to rise 15.5% in 2026
According to Gartner’s July 2026 forecast, worldwide software spending is projected to rise from $1.271 trillion in 2025 to $1.468 trillion in 2026, a 15.5% increase. These figures reflect spending on software products and platforms, not custom-development revenue alone. Gartner Worldwide IT Spending Forecast
The wider picture is just as revealing: global IT spending is projected at $6.369 trillion for 2026, up 14.2%, while IT services spending is forecast at $1.570 trillion, growing 5.3%. Different parts of the technology economy are expanding at different speeds. A related Medium analysis of rising software spending and delivery constraints examines why expenditure growth and engineering outcomes may diverge.
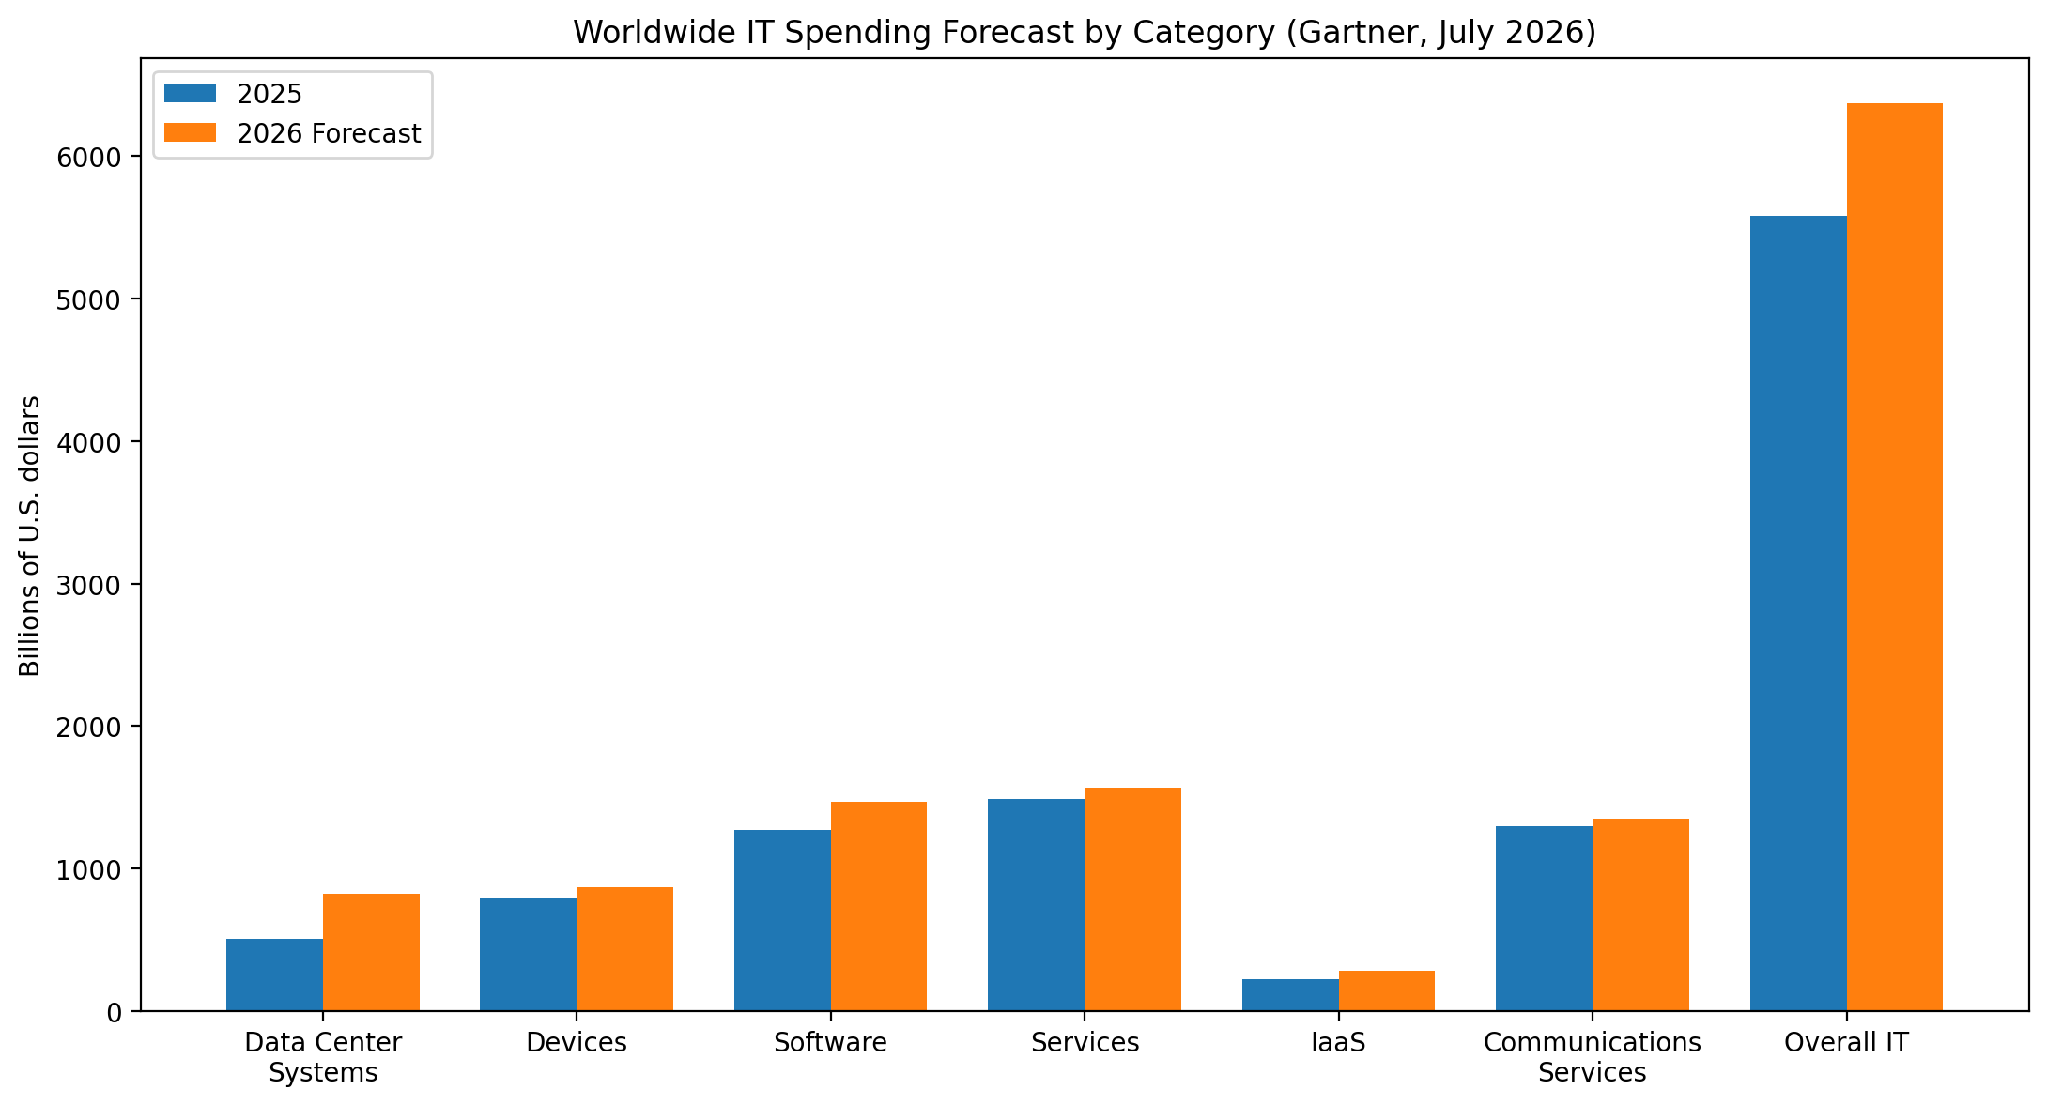
Figure 1. Gartner spending forecasts, 2025 versus 2026 (USD billions). Overall IT is a total, not an additional spending category. Source: Gartner worldwide IT spending forecast
A notable difference appears in infrastructure. Data center systems spending is expected to grow 62.5%, while infrastructure-as-a-service spending is forecast to rise 29.3%. The figures reflect investment in computing capacity and cloud platforms supporting demanding software and AI workloads.
2. Software developer population and employment statistics
GitHub has more than 180 million developer accounts
GitHub’s 2025 Octoverse reports over 36 million new developer accounts during the year, more than 180 million developers on its platform, and 630 million total projects. India contributed more than five million new accounts, representing over 14% of new sign-ups. Source: GitHub Octoverse 2025
US software-related employment is projected to grow 10%
The US Bureau of Labor Statistics projects employment of software developers, QA analysts and testers to increase from 1,905,400 in 2025 to 2,090,800 in 2035, growth of 10%, compared with 3% across all occupations. BLS Occupational Outlook Handbook
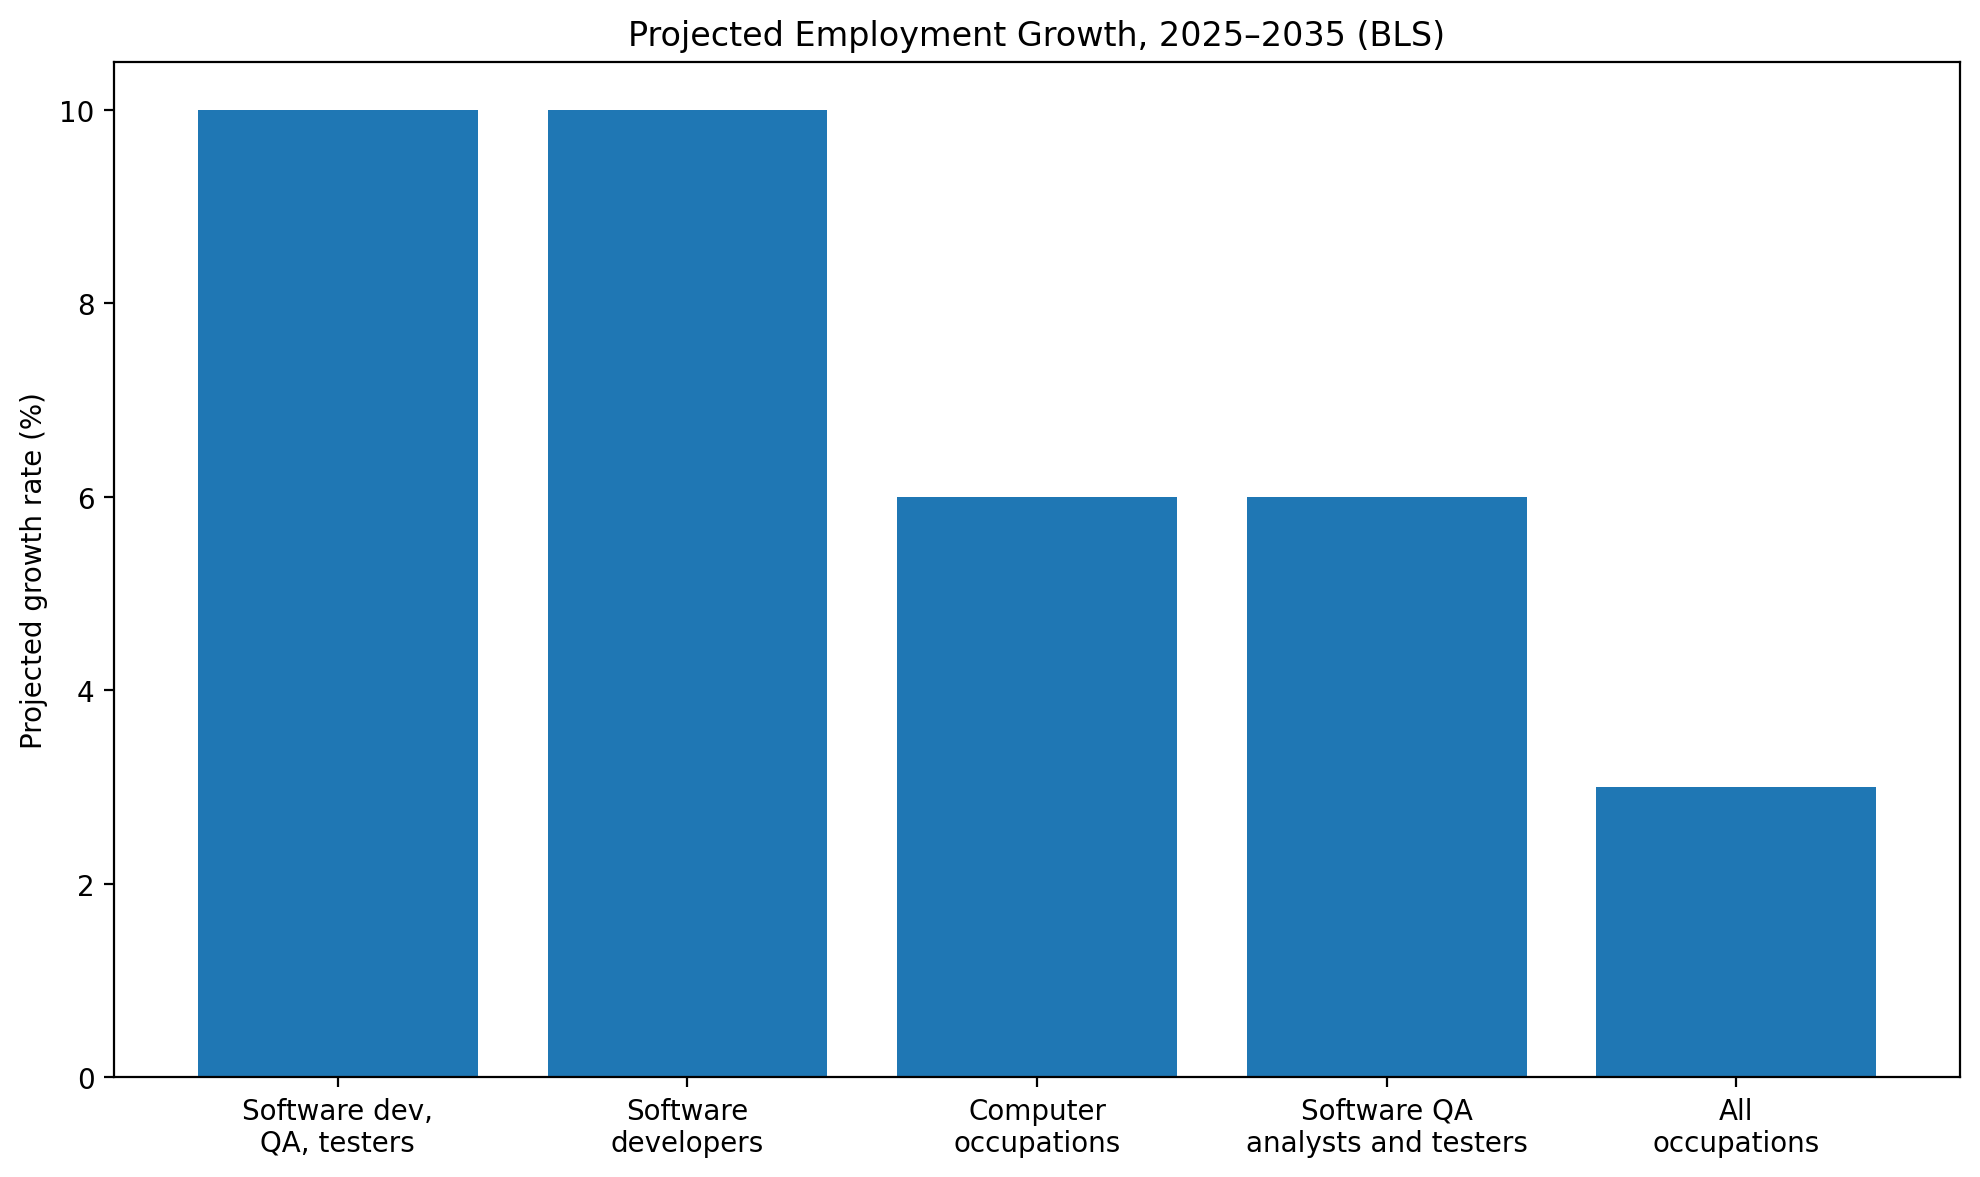
Figure 2. BLS US employment growth projections, 2025-2035. Developer-only and combined developer/QA categories overlap. Source: US Bureau of Labor Statistics
The projected increase of roughly 185,400 positions across the combined US developer and QA occupational group is a meaningful labor-market signal. It also places the 10% growth estimate in context: the BLS projects only 3% growth for all US occupations over the same decade.
What do software developers earn?
The median US annual wage for software developers was $135,980 in May 2025. The median for software QA analysts and testers was $104,300. Developers in software publishing earned a median $164,550, compared with $132,050 in computer systems design and related services.
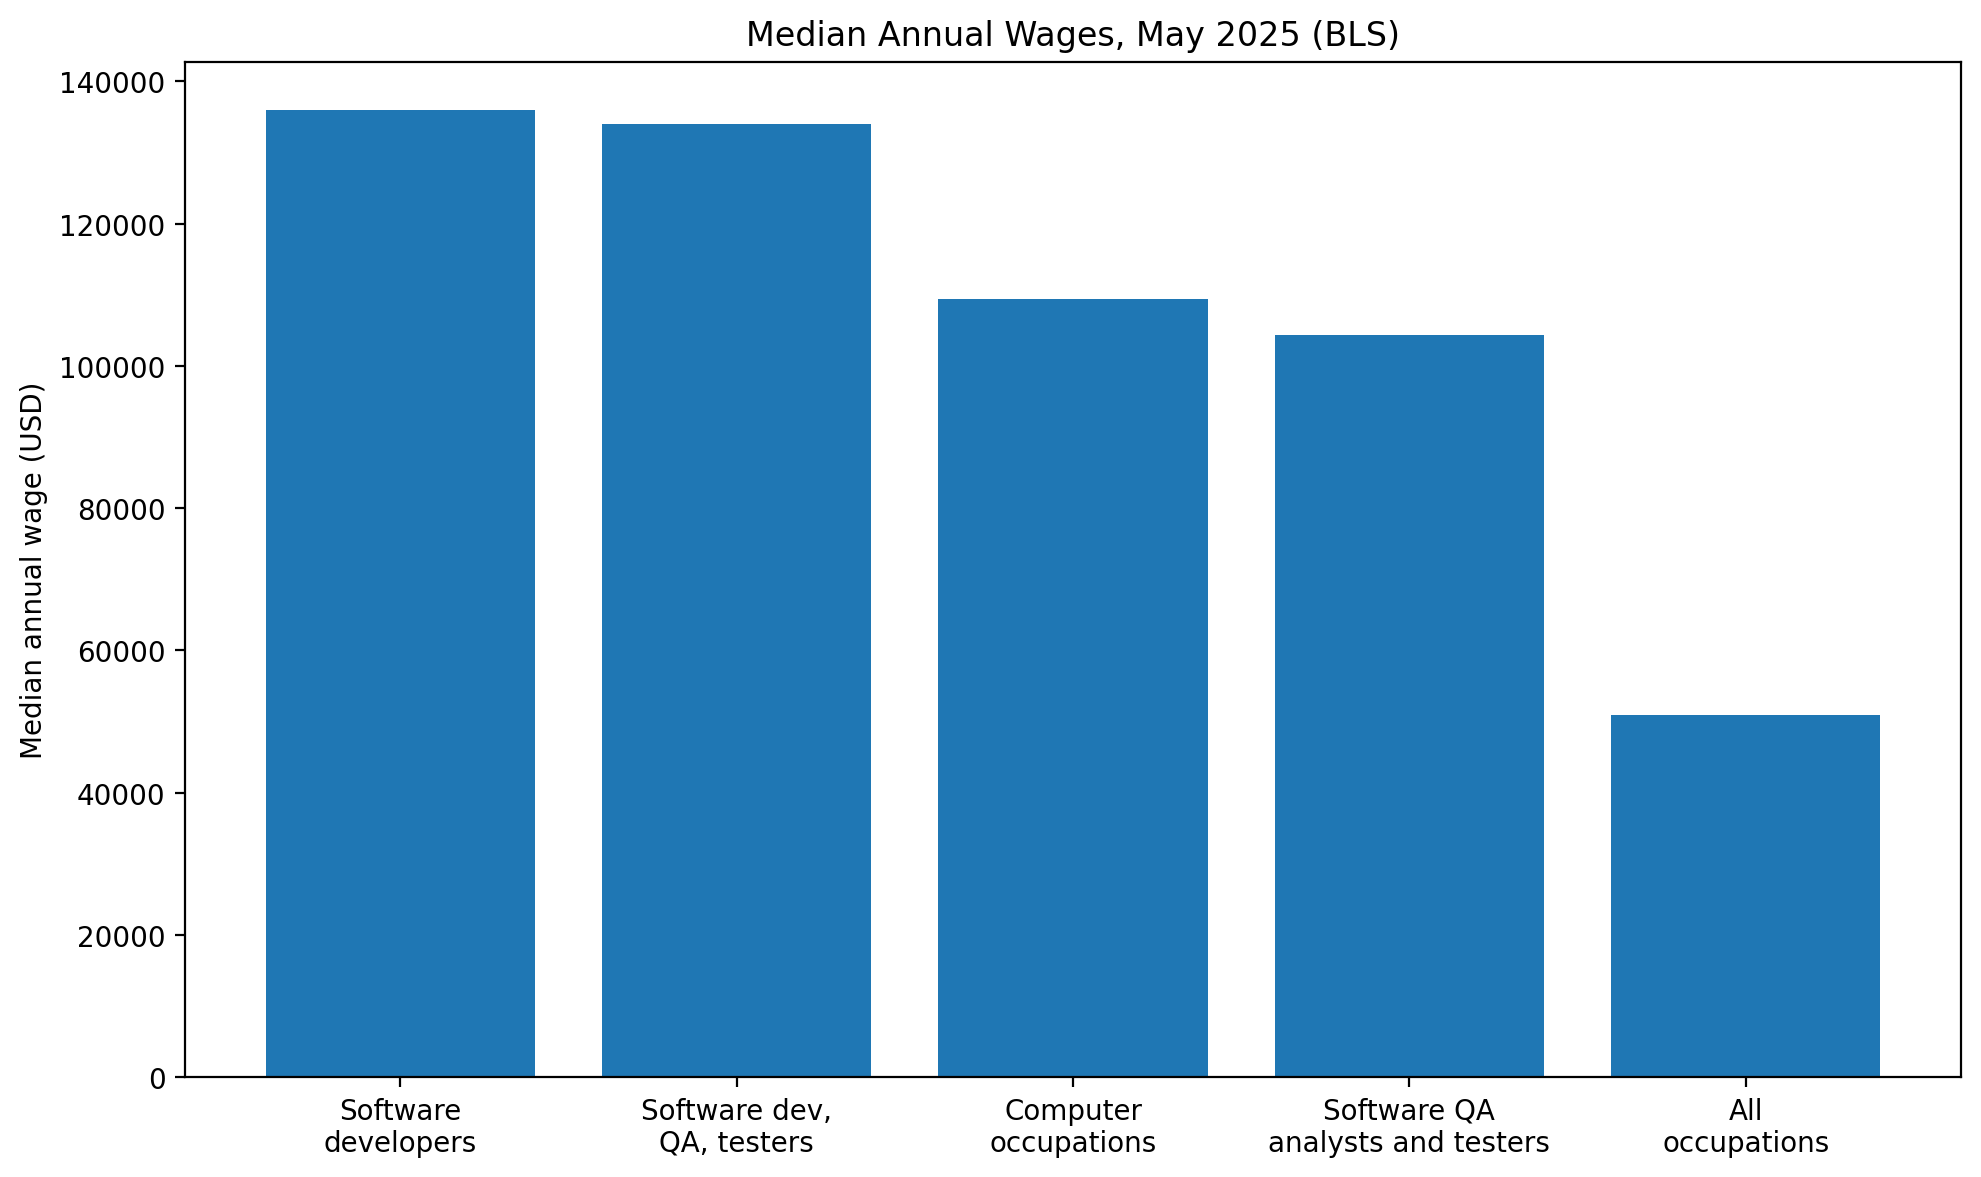
Figure 3. Median annual wages for selected US occupations, May 2025 (USD). Source: US Bureau of Labor Statistics
For international wage research, report salary figures with their geography, occupation and year. The US medians above describe wages, not agency billing rates or a complete project budget.
3. Programming language and development technology statistics
JavaScript leads usage; Python and SQL are close behind
The Stack Overflow Developer Survey 2026 provides a clear snapshot of languages used extensively in the previous year. Among 14,099 respondents to the relevant question, JavaScript was selected by 62.0%, SQL by 58.4%, HTML/CSS by 58.2%, Python by 58.0%, Bash/Shell by 51.3%, and TypeScript by 43.8%. Respondents could choose several languages, so the percentages do not sum to 100%. Source: Stack Overflow Developer Survey 2026 , languages
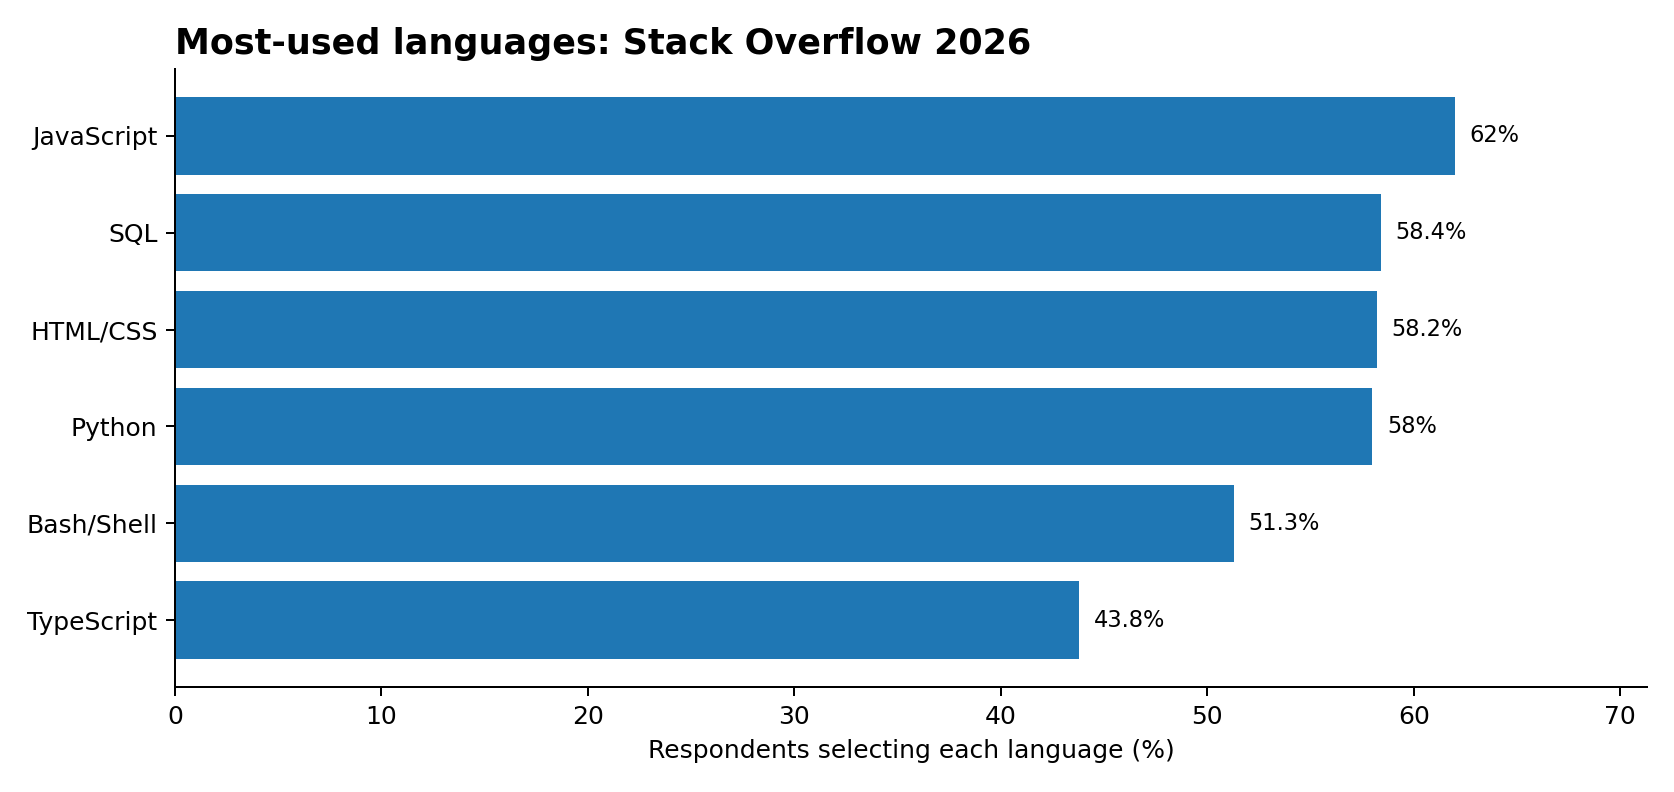
Figure 4. Languages used extensively, Stack Overflow 2026 (n=14,099; multiple responses permitted; not market share). Stack Exchange Inc., ODbL 1.0. Source: Stack Overflow Developer Survey 2026 , languages
JavaScript leads the Stack Overflow respondent sample, while Python, SQL and TypeScript also have extensive usage. Their percentages are not market shares: a developer can report working with several languages. Together they indicate that modern application development typically spans front-end, back-end and data layers.
GitHub reports TypeScript overtook Python and JavaScript
GitHub’s Octoverse describes TypeScript overtaking Python and JavaScript in August 2025 to become the most-used language on GitHub by its platform measure. That finding is not at odds with JavaScript leading Stack Overflow’s survey: the sources measure different populations and activity.
This trend provides context for how software development is changing: language ecosystems continue evolving alongside development tooling, quality expectations and AI assistance.
The 2026 Stack Overflow data also shows different developer preferences beneath language usage: TypeScript was used extensively by 43.8% of respondents to its language question, while Rust was used by 18.0%. Yet Rust recorded a 67.4% “admired” score among those who had used it, compared with 53.0% for TypeScript. Usage and enthusiasm answer different questions when choosing a technology stack. Source: Stack Overflow language data
4. Cloud-native software development and infrastructure
The 2026 Stack Overflow survey also shows how widely cloud and development tooling is distributed. Among 10,889 respondents to its cloud-development question, 59.1% reported Docker / Docker Compose, 54.6% npm, 42.1% pip, 41.8% Amazon Web Services, 26.0% Kubernetes, 25.1% Microsoft Azure and 24.5% Google Cloud.
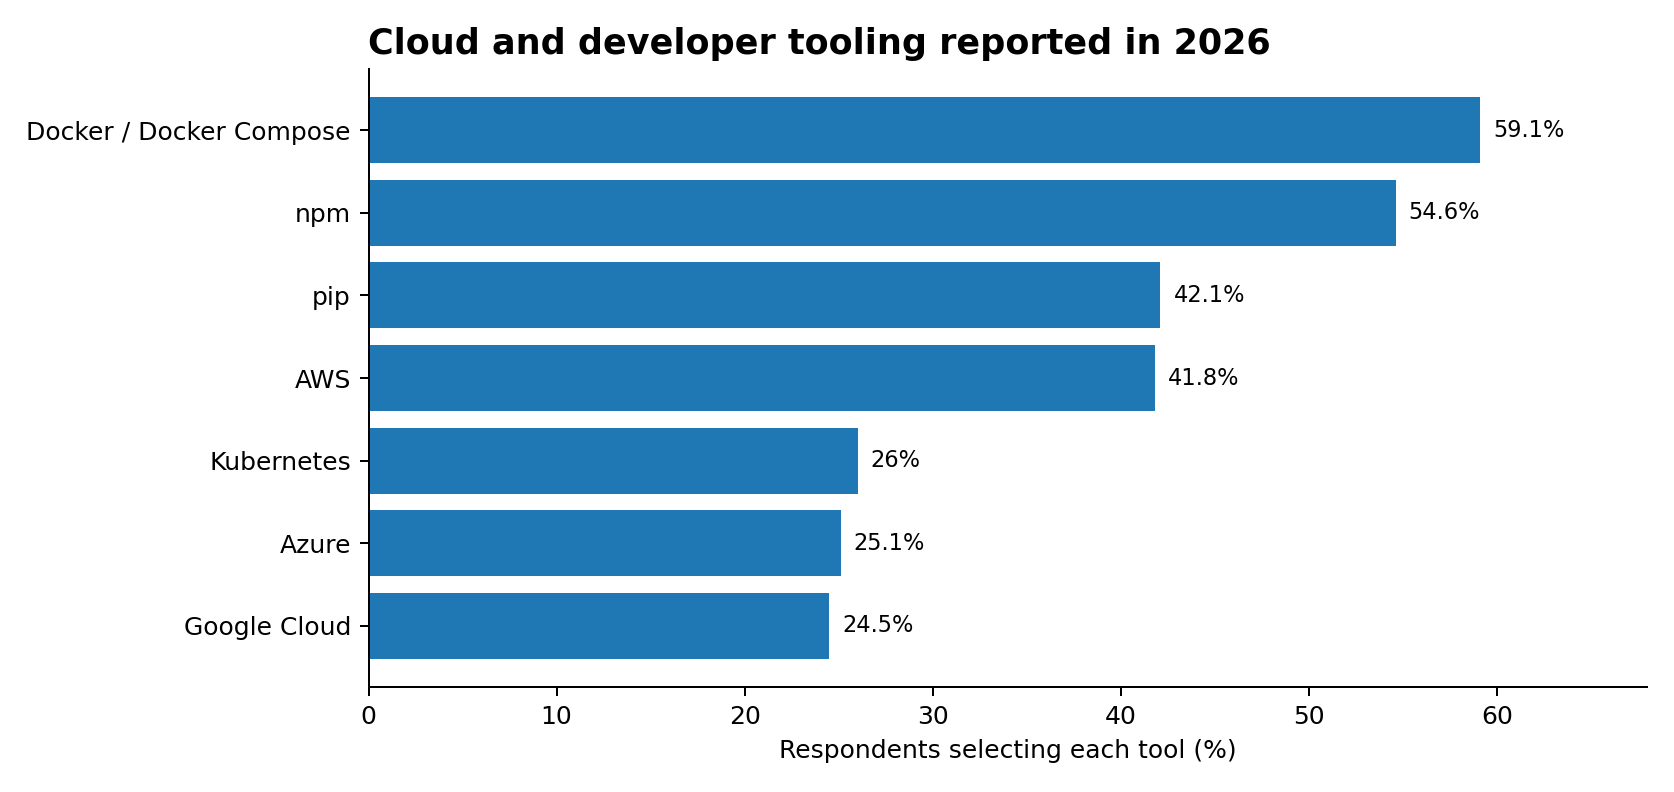
Figure 5. Selected cloud/development tools, Stack Overflow 2026 (n=10,889; multiple responses; mixed tool categories). Stack Exchange Inc., ODbL 1.0. Source: Stack Overflow Developer Survey 2026 , cloud development
Viewed by function, the survey shows package managers (npm and pip), container tools (Docker and Kubernetes), and cloud providers (AWS, Azure and Google Cloud) operating alongside one another. It is a snapshot of developers’ tool combinations, not a cloud-provider market-share ranking.
CNCF’s 2025 cloud native survey found that 82% of container users ran Kubernetes in production, up from 66% in 2023. Unlike the broader Stack Overflow tool-use question, CNCF specifically reports on respondents using containers. CNCF Annual Cloud Native Survey
5. AI in software development statistics
Nearly two-thirds of surveyed respondents use coding assistants or agents at work
Among 17,464 respondents to Stack Overflow’s 2026 AI-at-work question, 65.9% selected AI coding assistants or coding agents, 62.5% general-purpose AI chat tools, 26.2% AI agents or automated workflows, and 17.8% company-built AI tools. Some 17.2% reported no use of AI tools at work. Multiple answers were permitted. Source: Stack Overflow Developer Survey 2026 , AI tools
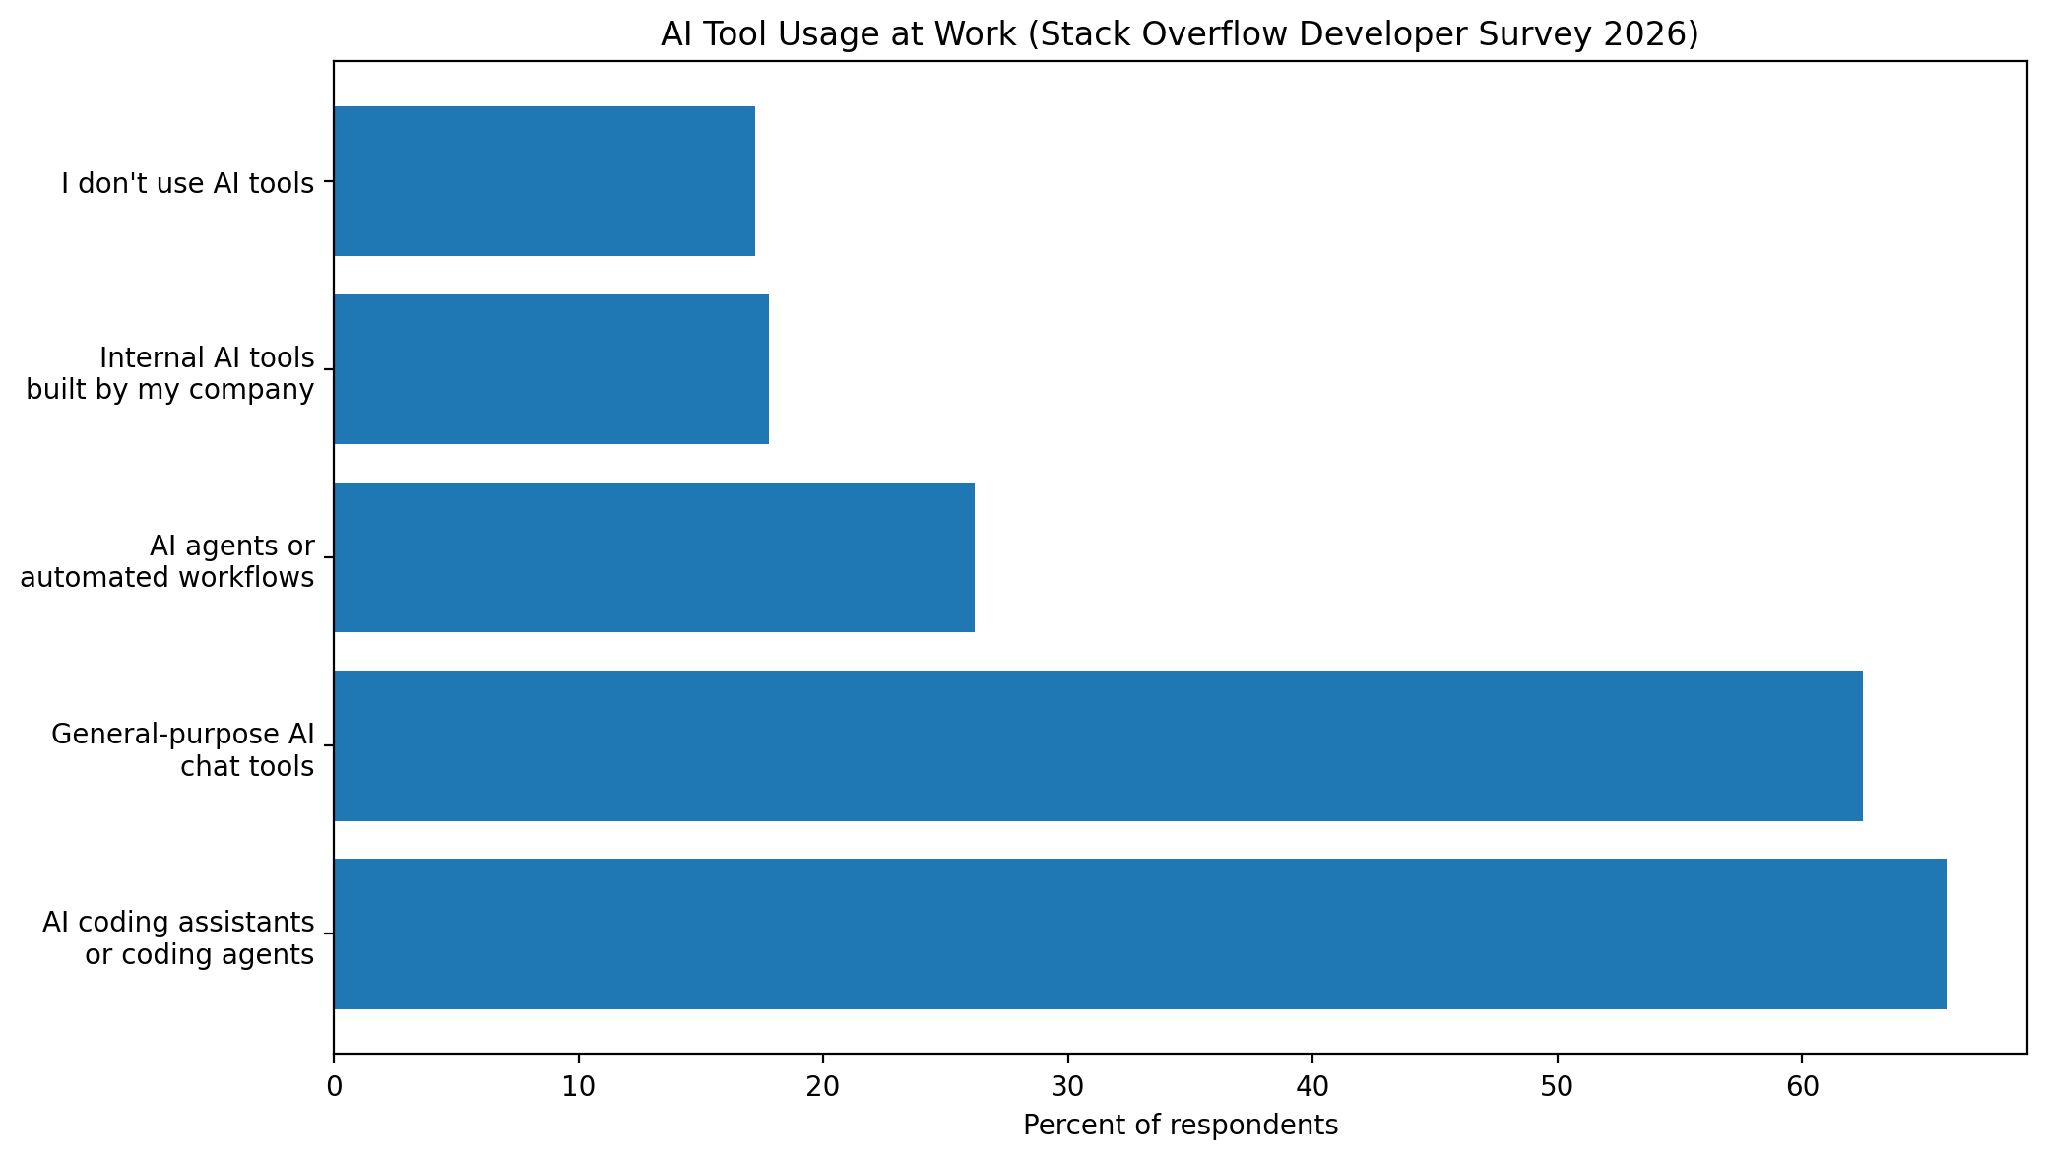
Figure 6. AI tool usage at work, Stack Overflow 2026 (n=17,464; multiple responses permitted). Stack Exchange Inc., ODbL 1.0. Source: Stack Overflow Developer Survey 2026 , AI tool use
The distinction is clear: 65.9% selected coding assistants or coding agents, compared with 26.2% selecting AI agents or automated workflows. Assistance inside a coding task is already reported more widely than automated, multi-step execution in this survey. A Hashnode comparison of coding assistants and AI agents examines that difference in everyday developer workflows.
For additional technical context, the related Toadster article on AI in software development examines implementation workflows. The survey figures here remain sourced directly to Stack Overflow.
Does AI coding assistance improve productivity?
Google Cloud’s 2025 DORA research reports that 90% of respondents used AI at work, more than 80% believed it increased productivity, and about 30% had little or no trust in AI-generated code. These are survey findings, not experimental estimates of time saved. DORA 2025 report
A 2025 randomized study by METR found experienced open-source developers took 19% longer to complete assigned tasks when using early-2025 AI tools in familiar repositories. That result applies to the particular tasks and tools studied, not all AI-assisted software development.
Read together, DORA and METR answer different questions. The Substack essay on the developer productivity paradox explores this gap between perceived gains and observed task performance. DORA reports widespread adoption and perceived productivity benefits across its surveyed professionals; METR’s controlled experiment measured task-completion time in a narrower setting. The combination supports reporting both experience and observed performance, without treating them as the same outcome.
AI use is also becoming routine among adopters. In Stack Overflow’s 2026 frequency responses, 73.0% of AI coding assistant or agent users reported daily use. That makes code review, permissions and verification practical workflow decisions rather than occasional pilot-project concerns. Source: Stack Overflow AI survey
6. Software quality, open-source security and delivery performance
More code is not the same as better software. DORA’s 2025 research found a positive association between AI adoption and delivery throughput, but a negative association with delivery stability. It emphasizes automated testing, version control and rapid feedback loops as important safeguards when output accelerates.
DORA measures throughput and delivery stability separately. The distinction matters when interpreting AI adoption: increasing the volume of generated or deployed changes is not automatically an improvement if subsequent failures and rework rise.
Project “failure” is not a single comparable industry metric. Cancellation, cost overrun, missed schedules and failure to deliver business value measure different outcomes; this article therefore does not repeat a universal software-project failure percentage without an agreed definition and source population.
A further engineering reality check comes from METR’s 2026 analysis of AI-generated pull requests: roughly half of the tested agent-produced changes that passed SWE-bench Verified tests would not have been accepted for merging by repository maintainers. Passing a test suite is not always the same as producing maintainable, review-ready code. Source: METR, March 2026
In Black Duck’s 2025 Open Source Security and Risk Analysis, 86% of 901 commercial codebases assessed in 2024 contained at least one vulnerability; 81% contained a high- or critical-risk vulnerability. These findings describe audited customer codebases, not all software projects. Black Duck 2025 OSSRA
7. Software developer salaries and IT outsourcing statistics
The US BLS gives verifiable wage benchmarks, including a May 2025 median of $135,980 for software developers. These are occupational wages rather than outsourced engineering rates. For a separate lens on commercial contracting, ISG measures annual contract values in larger outsourcing agreements.
ISG’s full-year 2025 Index reported $127.4 billion in combined annual contract value across monitored managed services and cloud-based as-a-service agreements, an 18% rise from 2024. The measure covers large contracts meeting ISG’s reporting threshold, not all custom software development work. ISG 2025 Index
Within that total, cloud-based as-a-service contracts accounted for $84.0 billion (up 29%) and managed services for $43.4 billion (up 1.3%). These diverging rates show why broad outsourcing growth headlines conceal significant differences between service models.
ISG separately reported $32.5 billion of IT outsourcing annual contract value (up 2.4%) and $3.6 billion for engineering research and development contracts (up 35%) in 2025. The latter category more directly signals demand for contracted engineering, although it is not the same as an average application-development project fee. ISG 2025 Index
8. Software development trends shaping the industry beyond 2026
Three linked shifts define the medium-term outlook: spending is moving toward AI-capable infrastructure, typed-language ecosystems are attracting development activity, and AI tooling is becoming routine in parts of engineering. The open question is whether organizations can turn those inputs into dependable software and measurable outcomes.
The sources use different clocks. GitHub describes 2025 platform behavior, Stack Overflow surveys 2026 developers, Gartner forecasts 2026 expenditure, and BLS projects US employment through 2035. None of them establishes a universal worldwide software-development forecast for 2030.
A productive research agenda is therefore to track deployment reliability, security remediation and maintained software alongside tool adoption. DORA’s throughput-versus-stability findings explain why engineering outcomes may lag behind gains in code-generation speed.
9. What these statistics mean for researchers and industry readers
For accurate comparisons, match each statistic to the population and economic activity it describes: Gartner measures spending, ISG measures large contract value, GitHub measures platform activity, and BLS measures US employment. They are complementary indicators, not pieces of a single global market total.
For publication, state the period and denominator close to the number. For example, “65.9% of 17,464 respondents to Stack Overflow’s 2026 AI-at-work question” is more useful and more defensible than “two-thirds of developers.”
Software development in 2026 is shaped by expanding investment in software and infrastructure, growing international developer participation, and widespread AI assistance. But adoption and expenditure are inputs, not outcomes. The decisive measures remain whether teams can deliver secure, reliable, maintainable software and demonstrate real value from the tools they use.